Corresponding lecture
Lecture slides – Data exploration
Description
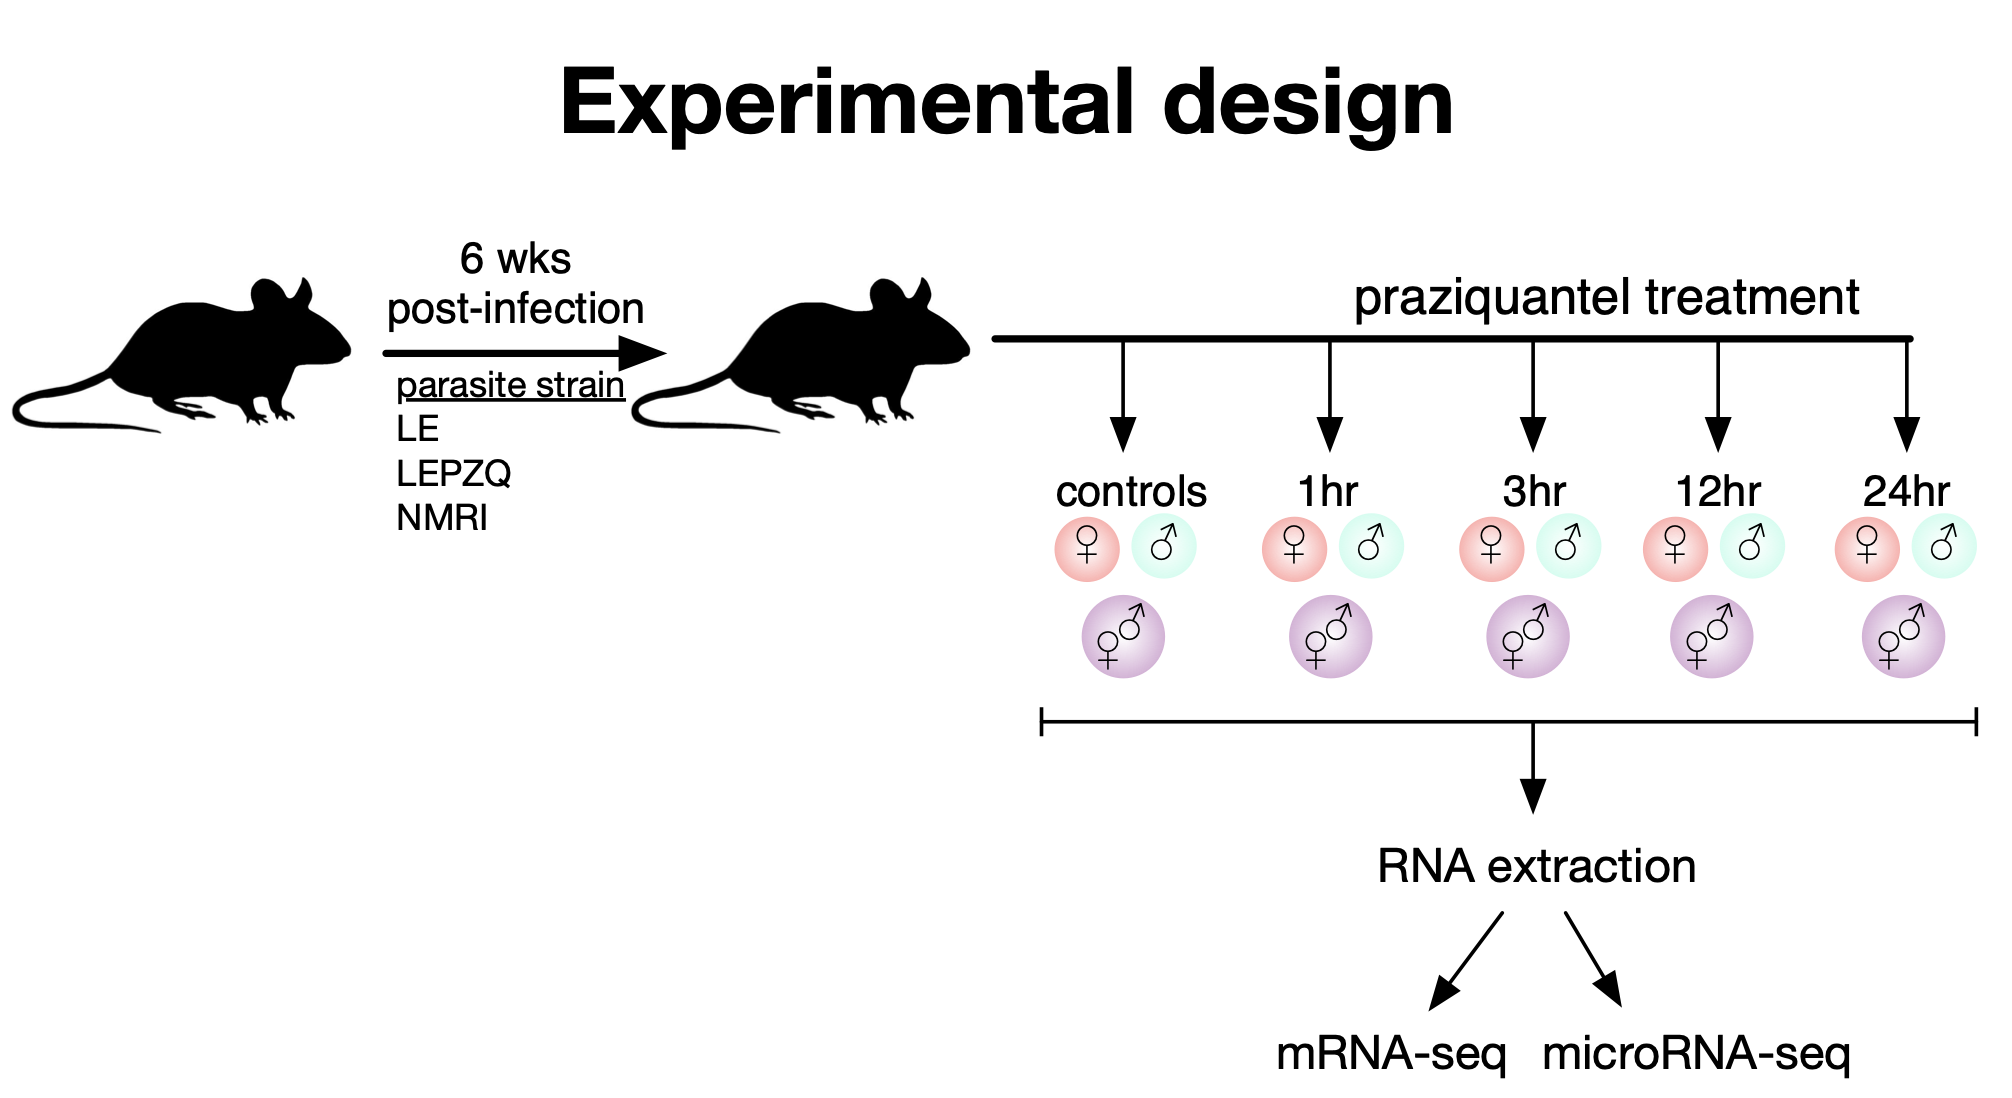
A colleague has asked for your help to mine data produced from a very large RNAseq study of the parasitc worm, Schistosoma mansoni. In this experiment, male (M), female (F), juvenile (J) and mixed sex (X) worms were recovered from infected mice at various timepoints (control, 3hr, 12hr, and 24hr) following in vivo treatment with a low dose of the frontline anti-parasitic drug, praziquantel. Experiments were carried out with three different strains of worms: NMRI, LE, and LEPZQ. In total, 144 samples were sequenced! To begin this challenge, you’ll need to download the Kallisto outputs and study design and read these data into a new R project.
To succeed in this lab, you will need to use the tools you’ve learned in class for filtering, normalizing, multivariate analysis with PCA, and data wrangling with dplyr.
The first team to submit the most complete answer (via private message on Discord) to the following three questions will win the challenge.
Getting started
- download fresh copies of the step 1, 2 and 3 scripts
- use only the ‘essential’ code chunks from these scripts to complete the challenge.
- don’t try to annotate the data, just import at the transcript level
Task 1 - visualize impact of filtering and normalization
You’ll need to read in the count data using the Step 1 script, then use the Step 2 script to create plots that show the impact of filtering and normalization on the data.
Tips
- Do not use ‘coord_flip’ in your ggplot code, as the number of samples is so large that horizontal display is preferred
- Don’t use cowplot to patch together your different ggplots into one figure. Again, the number of samples in this particular study makes this too cramped.
Task 2 - create and interpret PCA plot
Using the Step 3 script, can you identify which biological variables explain the majority of the variance in this dataset? Please include PCA plot(s) to support your answer.
Tips:
- take advantage of setting the ggplot aesthetics (aes) to map size and shape to different variables from your study design file
- a small-multiples plot can help examine more than two PCs at a time
Task 3 - identify and display top genes in table
Using dplyr ‘verbs’, identify the top 10 parasite genes induced by praziquantel treatment in female LE strain worms at the 24hr timepoint compared to control worms. The top 10 genes should be selected and ordered by average Log fold change for the groups of replicates. Please include a table to support your answer.
Anything interesting stand out to you about the top genes on your list (requires a literature search)?
Submit your work
When you’ve completed tasks 1, 2 and 3 above, combine the parts to create a multi-panel figure. Navigate to the ‘submit’ tab on the sidebar to upload your figure. This is due by the start of lab next week.
Before submitting your figure, be sure to take advantage of the lab ‘critic’ tab to get instant feedback and help you improve your work.
If you’re following along virtually, you can still crtique and submit a figure…the only difference is that due dates do not apply to you.